The fastest cyclists of Europe live in …
Analyzing STRAVA data to find out which city has the faster cyclists with R and R-shiny. My contribution to the shiny contest.
STRAVA is one of the most popular fitness tracking apps. It not only allows users to track their own activities but also following professionals. STRAVA made running and cycling a game for everybody. It split the world into segments. Each segment can be seen as a tiny race-track. STRAVA runs a leaderboard for each track. Now you will know how fast you are compared to others, without even running a real race. Just do it in a digital way. This feature was what I used to find out, which city in Europe has the fastest cyclists. Why all that? I wanted to participate in the R-Shiny Contest.
Before I start explaining how to find the fastest city, I have to say. There is no fastest city in Europe. The average speed of a city really depends on how you evaluate the city. London is really fast at a short distance, Paris on long distance, Munich people seem to be good climbers… Every one of those settings can be evaluated inside my app. So let’s start from the beginning.
Getting the data
I decided on four cities that I wanted to compare. The STRAVA API allows for 13,000 API calls a day, meaning 13,000 questions you can ask STRAVA on, for the non-programmers. This was my most limiting fact. I chose 4 cities, London, Paris, Berlin, and Munich (because I live here). Each city got split into squares of ~100m x 100m. For these squares, I called the API to get to know which STRAVA segments can be found here. In London, I found e.g. ~2000 segments by 9000 squares. For each of those segments, I called the API twice. Once for the leaderboard of the 30 fastest male cyclists and again for the leaderboard of the 30 fastest female cyclists. From these values, I calculated the average and median for male, female and both per segment. This is the data to start the calculations from.
Inside my app, at http://citycyclerace.engel-wolf.com you can use this data to compare cities. The app will use a basic setting to compare London against Paris and London will win the race. But now you can start changing settings to see if London is really the faster city.
Compare cities in different ways
The settings window allows e.g. changing the length of STRAVA segments. You can see if London people are better sprinters by choosing 0.0 to 1.0 km as the segment length. Or check out if Munich people are good on long distance segments by choosing 5.0–20.0 km segment length.
 Settings window inside the shiny app for cycle races
What also changes the settings a lot is whether you use average or median evaluation. The median tells you the speed of the 15th person inside your leaderboard assuming a distribution of your leaderboard. So actually, how fast will 50% of people on the leaderboard be indeed? While the average just takes the speed of each participant and divides it by the number of participants. A fast guy on place1 can move your board up front, which cannot happen on median calculations.
A great feature is the elevation factor. It adds a linear weight to the speed depending on how steep a segment is. The speed of a steeper segment gets increased by the formula: speed = elevation_factor * 0.1 * climb (in meters). This means the steeper your segment, the higher the speed is.
Last but not least you can run the whole calculation just for men or women.
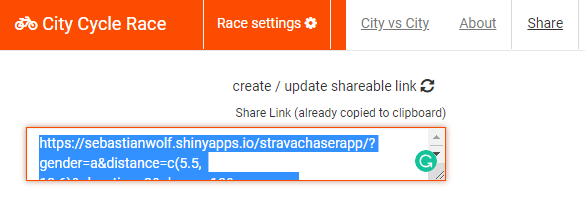
All settings can be stored and shared using the share feature of the app.
Visual features
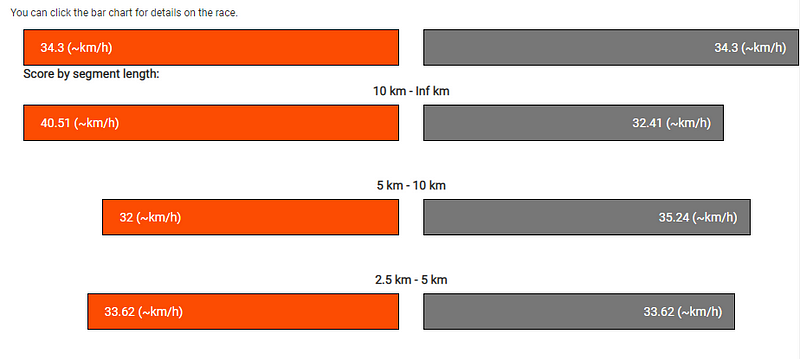
To compare the speed of the city I built in an animated bar plot. This one is based on the jQuery plugin simple skill bar. In R it has to be added as to be added as a specific output binding. Finally the speed of each city get’s animated:

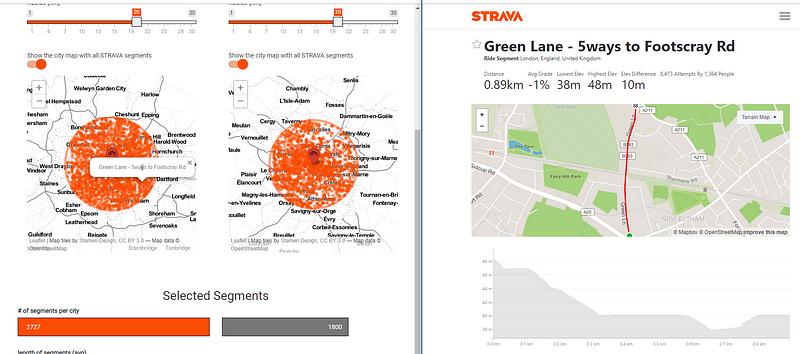
To visualize the segments that are used for the evaluation, I implemented a leaflet map within the app. The map does not only show the segments. It also highlights the speed of a segment. Moreover, users can access the STRAVA website to see details of the segment:
If users would like to see if a city has maybe faster people on longer or shorter segments, it is not needed to change the settings. Additionally, graphs plot the calculated speed for different length:
Play on
I hope you can now see, that there is no fastest city. It really depends on how you set up the features of this app. Please start enjoying the app. Here are some last facts about the app and please upvote it on the Shiny Contest Page.
# of segments in the app 421,685
# of segments with average speed (leaderboard crawled) 22,589
Average speed per segment 28.76 km/h
Average speed per segment (men) 32.7 km/h
Average speed per segment (women) 23.49 km/h
Average length of a segment 2162.3 m
App Code at is free-available: zappingseb/stravachaser
App runs on: shinyapps.io